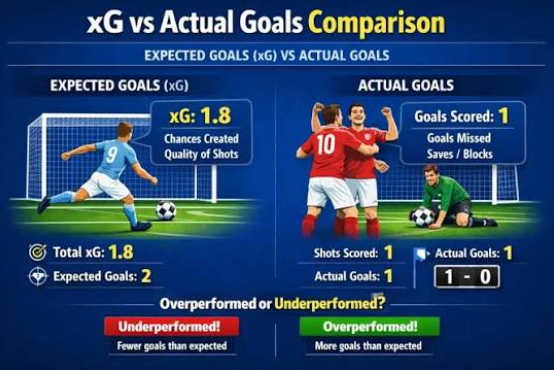
Understanding the Difference Between Expected Goals and Actual Goals in Football
Football is a game where the final score often tells only part of the story. A team can dominate possession, create numerous scoring opportunities and still lose against an opponent that scores from its only meaningful attack. In another match, a side might win comfortably despite creating fewer clear chances.
This is where football statistics become particularly interesting. Beyond goals, assists and possession, analysts increasingly rely on a measurement known as Expected Goals (xG) to understand how well teams create and convert scoring opportunities.
However, expected goals and actual goals are not the same thing. While one estimates the quality of chances created, the other records what happened on the pitch. Understanding the difference between these figures can provide a much clearer picture of football performance, finishing ability and match outcomes.
What Are Expected Goals (xG) in Football?
Expected Goals, commonly written as xG, is a statistical measurement that estimates how likely a particular scoring opportunity is to result in a goal.
Instead of simply counting shots, the statistic considers the quality of each opportunity. A shot taken from close range with little defensive pressure will generally receive a higher xG value than a difficult attempt from outside the penalty area.
For example, imagine a striker receiving a pass six yards from an open goal. The opportunity might have an xG value of 0.80, meaning that similar chances have historically resulted in goals approximately 80% of the time.
Meanwhile, a speculative shot from 30 yards might carry an xG value of just 0.03, suggesting that only around three out of every 100 similar attempts result in goals.
These figures do not guarantee what will happen during a particular match. They simply describe the probability associated with the opportunity.
When individual shot values are combined, they produce a team's total expected goals for a match.
What Are Actual Goals?
Actual goals are much easier to understand because they represent the goals a team genuinely scores during a football match.
Unlike expected goals, actual goals do not involve probability calculations or statistical estimates. They are simply the confirmed number of times a team puts the ball into the opponent's net.
For instance, if a team wins 3-1, its actual goals total is three, while its opponent has scored one. The interesting part comes when these results are compared with expected goals. A team might record an xG of 2.40 but score only once. Another could produce an xG of 0.70 and somehow find the net twice.
Both situations happen regularly in football, demonstrating why the final score does not always reflect the quality of opportunities created.
The Major Differences Between Expected Goals and Actual Goals
Although both statistics are connected to scoring, they measure different aspects of attacking performance.
Here are the most important distinctions.
1. Expected goals measure opportunity quality
Expected goals focus on the chances a team creates. They help explain whether a side is regularly getting into dangerous positions and producing opportunities that should realistically lead to goals.
A team with an xG of 2.80 has generally created better scoring opportunities than one with an xG of 0.65, even if the final score does not reflect that difference.
2. Actual goals measure finishing results
Actual goals show what players achieve when those opportunities arrive. They reflect the outcome of shooting attempts rather than the statistical quality of the chances.
A team can create several excellent opportunities but fail to score because of poor finishing, outstanding goalkeeping or unfortunate circumstances.
3. Expected goals are based on probability
An xG figure is calculated using historical information about similar shooting situations. It estimates the likelihood of scoring rather than predicting an exact result.
Actual goals, on the other hand, are confirmed events. There is no probability involved once the ball crosses the goal line.
4. The two statistics can reveal different performance patterns
Expected goals help analysts understand attacking consistency, while actual goals show the effectiveness of finishing.
Looking at both together provides a more balanced assessment of a team's attacking strength.
How Can Expected Goals and Actual Goals Differ?
There are several reasons why a team's expected goals might not match its actual scoring record.
· Finishing ability: Some attackers are naturally better at converting difficult opportunities. A striker with excellent technique, composure and decision-making may regularly score more goals than the xG value of their chances suggests.
· Goalkeeper performance: A goalkeeper can make outstanding saves that prevent high-quality opportunities from becoming goals. This can leave the attacking team's actual goals considerably lower than its xG.
· Defensive pressure: Although expected goals models consider several factors, including the position of defenders in some advanced models, the difficulty of executing a shot can still vary considerably between individual situations.
· Unfortunate misses: Footballers sometimes miss opportunities that appear easier to score than to miss. A player might send the ball over an open goal or hit the post from close range.
· Small sample sizes: A team might outperform its xG over two or three matches, but that does not necessarily mean it has developed exceptional finishing ability. Over a longer period, scoring numbers may move closer to expected figures.
What Does a High xG but Low Actual Goals Record Mean?
This is one of the most interesting situations when analysing football matches.
Imagine a team that records 2.60 expected goals but finishes the game with just one goal. Its players have created opportunities that would normally be expected to produce more goals.
There are several possible explanations. The forwards might be struggling with their finishing, the opposition goalkeeper could have produced an excellent performance, or the team might simply have experienced an unusually unlucky afternoon.
For analysts, this situation can be worth monitoring. If the team continues creating high-quality chances, there may be reasons to expect an improvement in its scoring record. However, consistently wasting opportunities could also indicate a genuine weakness in its attacking department.
The important thing is to examine the wider performance rather than automatically assuming that more goals will follow.
How to Use Both Statistics When Analysing Football Matches
Expected goals and actual goals become more useful when considered together rather than separately.
Here are some practical ways to interpret them:
- Compare recent performances: Examine a team's xG and actual goals across several matches to understand whether its attacking output is improving or declining.
- Assess attacking consistency: Teams regularly producing high xG figures are generally creating promising scoring opportunities.
- Evaluate finishing efficiency: Compare actual goals with xG to identify whether a team is converting chances above or below its expected level.
- Study defensive performance: Compare the xG conceded with actual goals allowed to understand the quality of opportunities opponents are creating and how effectively the defence and goalkeeper are dealing with them.
- Look beyond the final score: A team that loses despite producing significantly higher xG may have performed better in terms of chance creation than the result suggests.
It is also important to remember that xG models differ between statistical providers. Some consider additional details, such as defensive positioning and the type of assist, while others use more basic information.
Therefore, comparisons are best made using figures from the same data provider.
Conclusion
Understanding the difference between expected goals and actual goals in football can change how people interpret match performances. Expected goals explain the quality of scoring opportunities, while actual goals show what teams manage to convert.
Neither figure tells the entire story independently. A team can create excellent chances without scoring, while another can produce a remarkable finishing performance from limited opportunities.
By examining both statistics together, football fans and analysts can gain a better understanding of attacking efficiency, finishing ability and overall team performance. Ultimately, the final score decides the winner, but the numbers behind it often reveal a much deeper story.








💬 Comments (0)
No comments yet. Be the first!
Leave a Comment